Most of you would probably agree that we are living in a world full of information. Before going to a movie, you can check online and see how people think of it. There are just so many reviews and opinions out there on the web.
What happens when information about an option comes from multiple sources? |
 |
Another example. A little dinosaur is going to meet his friend. Because he has short hands, it is really inconvenient for him to take an umbrella. He wants to bring an umbrella only if he needs it. Fortunately, the weather forecast shows that today is a sunny day. He opens the door happily, BUT there are masses of dark clouds in the sky. Now, what should he do? Should he bring an umbrella? |
In this line of research, we are interested in how people evaluate and combine different sources of information. We would like to know the underlying neural and computational mechanisms for such ‘information-integration computations’. |
We started this line of projects in 2012 and focused on one class of integration – How do people integrate information coming from the past and present? |
To answer this question, we have developed a task – a value-based probabilistic inference task – that allowed us to systematically manipulate past (prior information) and present experience (likelihood information). We combine Bayesian decision theory with fMRI to investigate neural systems that are involved in integrating prior and likelihood information. The first paper from this line was published recently (Ting et al., 2015 J Neurosci). |
We are actively investigating two issues: (1) Integration under gains and losses: When an event of interest is associated with a monetary reward, do people integrate prior and likelihood information differently from situations in which the event is associated with losses? (2) Integration and information reliability: How do the reliability of prior and likelihood information affect the weighting people assign to these sources of information? |
Below we describe the task that investigates the second question. |

There are two sessions in our study: prior learning session (behavior) and integration session (fMRI).
In the prior learning session, subjects learn two kinds of reward probability distributions represented as two symbols. The mean of these two prior distributions are the same at 0.5, but the variance are different. One of them represents as high uncertainty information (The distribution variance is high) and the other represents as low uncertainty information (low variance). |
 |
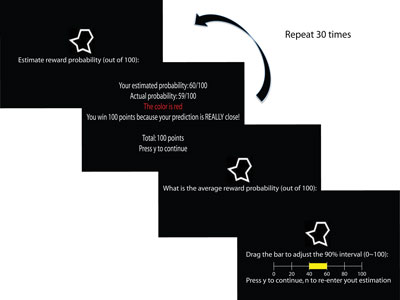
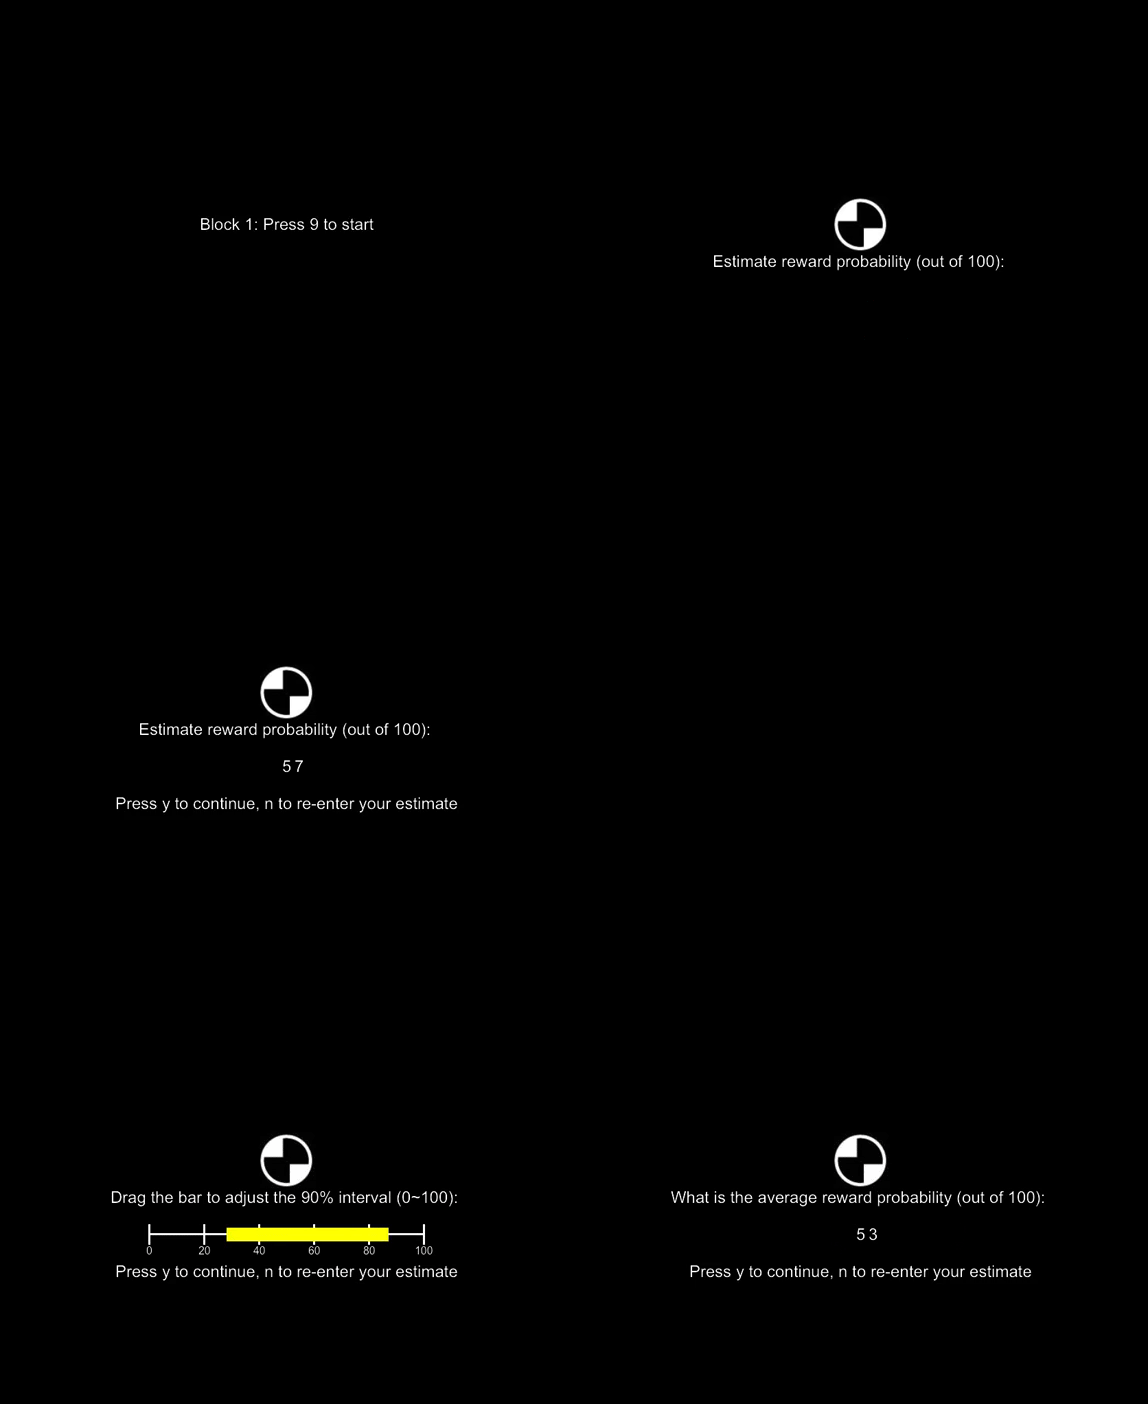
Participants are told that each symbol is assigned to a specific box. In the box, there are lots of lotteries, and the reward probability distribution of the lotteries is different in different boxes. In this session, participants have to learn the reward probability distribution of the two symbols. At each trial, they have to predict the reward probability on the lottery sampled from a symbol box. Then, the actual probability on the lottery is revealed. The closer participants’ prediction to the actual probability, the more reward they earn. This procedure provides the subjects an incentive to learn the distribution of the symbol boxes. |
  |
|
In the integration session, participants have to integrate the learned symbols (prior information) and new information (likelihood information) to make decisions. On each trial, these two sources of information are shown on the screen.
What is Likelihood information here?
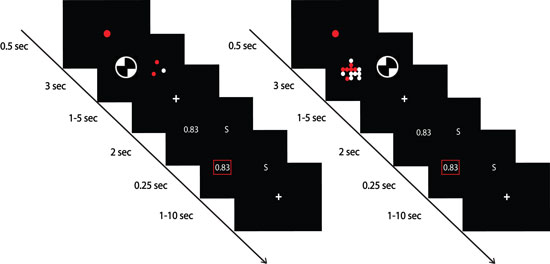
On a trial, the reward probability of the symbol lottery is determined by sampling from the probability distribution corresponding to the prior symbol shown in that trial. This probability is not directly revealed to the subjects. Here, we sample from this reward probability and present the outcomes to the subjects. This is the Likelihood information. We present the outcomes as colored dots. Each dot represents an outcome of the lottery realization. A red dot represents a reward outcome, and a white dot represents a no-reward outcome. The number of times the lottery is realized -- the number of dots -- is the sample size and is a critical variable to manipulate. In brief, the larger the sample size, the more reliable the likelihood information -- the proportion of red dots would be closer to the reward probability of the lottery.
After information about the symbol lottery is shown, information about the other lottery -- referred to as the alternative lottery -- is revealed in numeric form. In the example shown, the alternative lottery has a 83% of winning a reward. The subjects are asked to indicate which lottery -- symbol lottery or the alternative lottery -- she or he preferred with a button press. The magnitude of reward associated with both lotteries is the same. The only difference is on the reward probability. |
  |
|


